Tutorial 2, Alignment of spatial transcriptomics and translatomics of the mouse brain#
import sys
sys.path.append(r"/home/wangheqi/PycharmProject/")

import numpy as np
import pandas as pd
import scanpy as sc
import anndata as ad
import numpy as np
import torch

import matplotlib.pyplot as plt
import spcoral
Read the data#
The STAR and RIBO data can be download from https://singlecell.broadinstitute.org/single_cell/study/SCP1835.
We used the 5th dataset as the input to test alignment module of SPCoral.
adata_STAR = sc.read_h5ad('/csb3/project/wangheqi_meta/data/PMID39294367/adata_STAR_5_test.h5ad')
adata_RIBO = sc.read_h5ad('/csb3/project/wangheqi_meta/data/PMID39294367/adata_RIBO_5_test.h5ad')
adata_STAR = adata_STAR[adata_STAR.obs['replicate'] == 'rep2', :]
adata_STAR.X = adata_STAR.layers['raw']
adata_RIBO.X = adata_RIBO.layers['raw']
Preprocess multi-omics data#
# Normalizing to median total counts
sc.pp.normalize_total(adata_STAR)
# Logarithmize the data
sc.pp.log1p(adata_STAR)

sc.pp.highly_variable_genes(adata_STAR, flavor='seurat_v3', n_top_genes=1000)
adata_STAR = adata_STAR[:, adata_STAR.var['highly_variable'] == True].copy()
WARNING: adata.X seems to be already log-transformed.
# Normalizing to median total counts
sc.pp.normalize_total(adata_RIBO)
# Logarithmize the data
sc.pp.log1p(adata_RIBO)

sc.pp.highly_variable_genes(adata_RIBO, flavor='seurat_v3', n_top_genes=1000)
adata_RIBO = adata_RIBO[:, adata_RIBO.var['highly_variable'] == True].copy()
WARNING: adata.X seems to be already log-transformed.
# selected preprocessed data as the input
adata_STAR.obsm['feat'] = adata_STAR.X
adata_RIBO.obsm['feat'] = adata_RIBO.X
Model training#
Model = spcoral.model.regist_model(
    adata_omics1 = adata_STAR,
    adata_omics2 = adata_RIBO,
    graph_method = 'radius',
    n_layer=[1, 3, 5, 7, 9, 11, 13, 15],
    radius_spatial_omics1 = 500,
    radius_spatial_omics2 = 500,
    alpha = 0.1,
    epochs=200,
    random_seed=2030,
    device = torch.device('cuda:0')
)
[Fast Mode] Seed=2030, cudnn.benchmark=True, multi-thread ON
adata_STAR, adata_RIBO, loss_list = Model.train()
adata_STAR, registering_parameters = spcoral.model.registration(
    adata_STAR, adata_RIBO, n_iter=10, beta=0.9, method='rigid'
)
[Fast Mode] Seed=2030, cudnn.benchmark=True, multi-thread ON
The number of anchors is 750
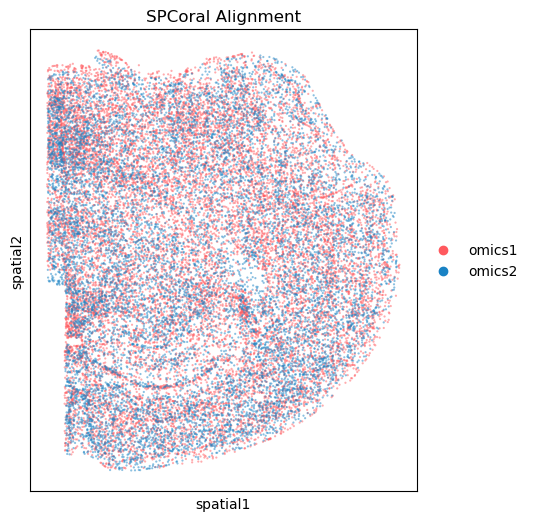
Visualization of output#
%matplotlib inline

fig, ax = plt.subplots(figsize=(5, 6), dpi=100)

spcoral.plot.show_cross_align(
    adata_STAR, adata_RIBO,
    omics1_use_obsm='spatial_reg',
    omics2_use_obsm='spatial',
    ax=ax,
    size_omics1=10,
    size_omics2=10,
    alpha_omics1=0.5,
    alpha_omics2=0.5,
    title='SPCoral Alignment',
    show=False
)
<Axes: title={'center': 'SPCoral Alignment'}, xlabel='spatial1', ylabel='spatial2'>
palette = {
    'Cerebal nuclei': '#1f77b4',
    'Cortical subplate': '#ff7f0e',
    'Fiber tracts': '#2ca02c',
    'Hippocampal region': '#d62728',
    'Hypothalamus': '#9467bd',
    'Isocortex': '#8c564b',
    'Olfactory areas': '#bcbd22',
    'Thalamus': '#e377c2',
    'other': '#7f7f7f',
}
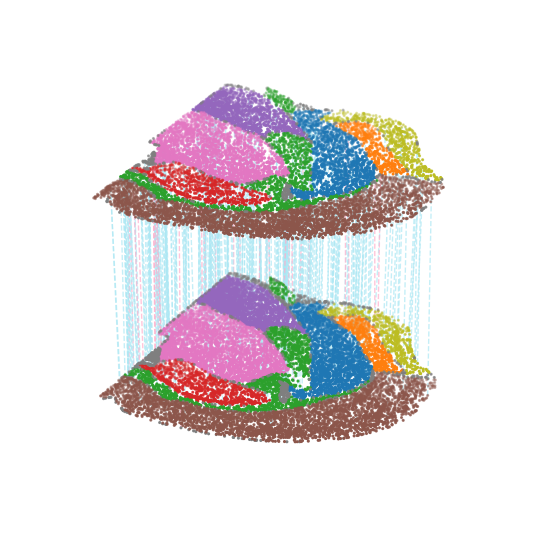
ax = spcoral.plot.show_cross_align_3D(adata_STAR, adata_RIBO, registering_parameters, color_based='region',color=palette,
                                 omics1_use_obsm='spatial_reg', omics2_use_obsm='spatial', line_width=1, show=False)
dataset1: 9 cell types; dataset2: 9 cell types;
                    Total :9 celltypes; Overlap: 9 cell types
                    Not overlap :[[]]
Subsampled 300 pairs from 750
%matplotlib inline
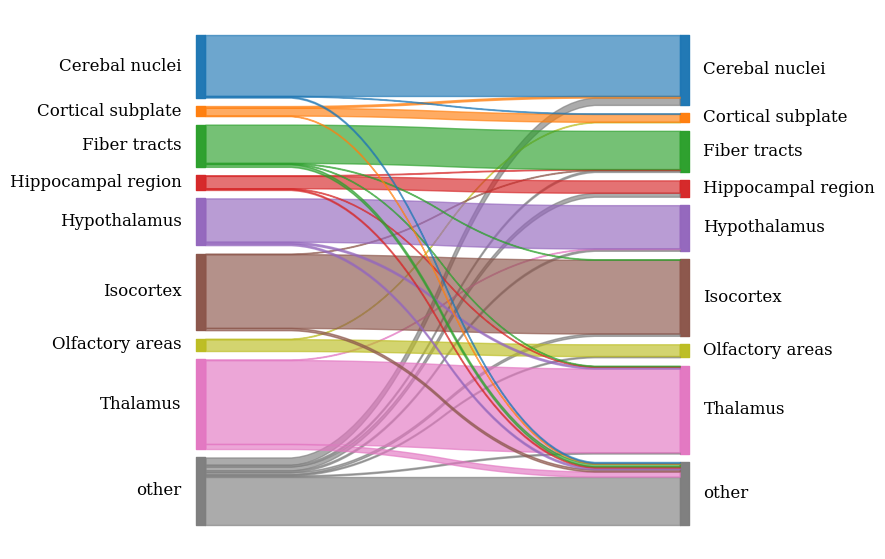
leftLabels = ['other', 'Thalamus', 'Olfactory areas', 'Isocortex', 'Hypothalamus',
'Hippocampal region', 'Fiber tracts', 'Cortical subplate', 'Cerebal nuclei']
rightLabels = ['other', 'Thalamus', 'Olfactory areas', 'Isocortex', 'Hypothalamus',
'Hippocampal region', 'Fiber tracts', 'Cortical subplate', 'Cerebal nuclei']
ax = spcoral.plot.show_cross_anchor_Sankey(adata_STAR, adata_RIBO, registering_parameters, celltype_label='region', color_map=palette,
show=False, leftLabels=leftLabels, rightLabels=rightLabels
)