Tutorial 1, Alignment of simulated data#
import sys
sys.path.append(r"/home/wangheqi/PycharmProject/")

import numpy as np
import pandas as pd
import scanpy as sc
import anndata as ad
import numpy as np
import torch

import matplotlib.pyplot as plt
import spcoral
Prepare the dataset#
Download this data from google drive.
There are a total of four types of patterns available here(‘enhanced’, ‘enhanced2’, ‘layers’, ‘island’).
Each pattern have 5 different samples.
pattern = 'layers'
num = '1'

adata_rna = sc.read_h5ad(f'/home/wangheqi/PycharmProject/data/alignment_sim/RNA_sim/{pattern}/adata_rna_trans_sim{num}.h5ad')
adata_atac = sc.read_h5ad(f'/home/wangheqi/PycharmProject/data/alignment_sim/ATAC_sim/{pattern}/adata_atac_sim{num}.h5ad')
adata_atac.var_names = ['atac' + i for i in adata_atac.var_names.tolist()]
adata_rna.obsm['spatial_raw'] = adata_rna.obsm['spatial']
adata_rna.obsm['spatial'] = adata_rna.obsm['spatial_transformed']
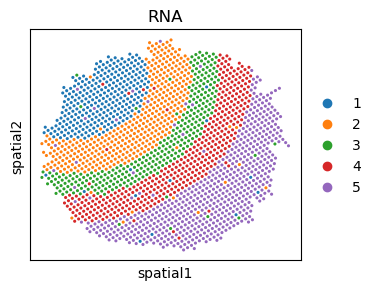
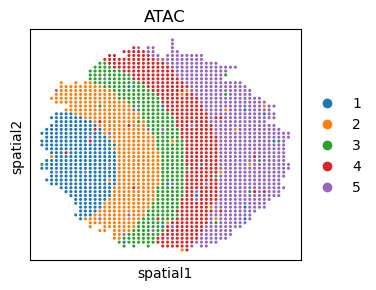
Visualization of cell type of the pair multi-omics data.
%matplotlib inline

fig, ax = plt.subplots(figsize=(3.5, 3))
sc.pl.embedding(adata_rna, basis='spatial', color='cell.type', ax=ax, s=20, title='RNA')
fig, ax = plt.subplots(figsize=(3.5, 3))
sc.pl.embedding(adata_atac, basis='spatial', color='cell.type', ax=ax, s=20, title='ATAC')
Preprocess multi-omics data#
# Normalizing to median total counts
sc.pp.normalize_total(adata_rna)
# Logarithmize the data
sc.pp.log1p(adata_rna)
sc.pp.scale(adata_rna)
# Normalizing to median total counts
sc.pp.normalize_total(adata_atac)
# Logarithmize the data
sc.pp.log1p(adata_atac)
sc.pp.scale(adata_atac)
# selected preprocessed data as the input
adata_rna.obsm['feat'] = adata_rna.X
adata_atac.obsm['feat'] = adata_atac.X
Model training#
Model = spcoral.model.regist_model(
    adata_omics1 = adata_rna,
    adata_omics2 = adata_atac,
    graph_method = 'radius',
    radius_spatial_omics1 = 1.1,
    radius_spatial_omics2 = 1.1,
    alpha = 0.1,
    epochs=200,
    random_seed=2030,
    device = torch.device('cpu')
)
[Fast Mode] Seed=2030, cudnn.benchmark=True, multi-thread ON
adata_rna, adata_atac, loss_list = Model.train()
adata_rna, registering_parameters = spcoral.model.registration(
    adata_rna, adata_atac, n_iter=0, beta=0.9, method='rigid'
)
[Fast Mode] Seed=2030, cudnn.benchmark=True, multi-thread ON
The number of anchors is 2000
Visualization of the output#
%matplotlib inline
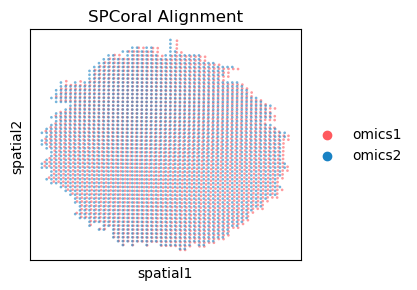
fig, ax = plt.subplots(figsize=(3.5, 3))
spcoral.plot.show_cross_align(
adata_rna, adata_atac,
omics1_use_obsm='spatial_reg',
omics2_use_obsm='spatial',
ax=ax,
size_omics1=15,
size_omics2=15,
alpha_omics1=0.6,
alpha_omics2=0.6,
title='SPCoral Alignment',
)
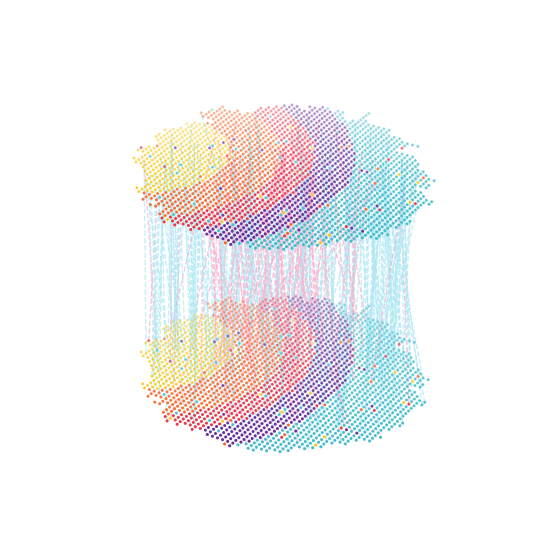
%matplotlib inline

spcoral.plot.show_cross_align_3D(
    adata_rna, adata_atac, registering_parameters, color_based='cell.type',
    omics1_use_obsm='spatial_reg', omics2_use_obsm='spatial', line_width=1, show=False
)
dataset1: 5 cell types; dataset2: 5 cell types;
                    Total :5 celltypes; Overlap: 5 cell types
                    Not overlap :[[]]
Subsampled 300 pairs from 2000
{'color_type': 'categorical', 'palette': ['#f9c80e', '#f86624', '#ea3546', '#662e9b', '#43bccd']}
<Axes3D: >